A Power Apps platform that cut reporting time by 30% across 4 departments
I digitised the visual management of four departments at Cartier. A DMAIC study first, then a Power Apps platform on live enterprise data. Reporting time went down 30% and 50+ users were trained.
The problem
Four departments tracked the same things in four different ways. Visual management ran on boards and files that each team updated by hand. Reporting was manual and spread across several places, and the numbers were usually a little out of date by the time someone used them.
DMAIC before code
I ran it as a Lean project first. I mapped the existing processes of the four departments with value stream mapping, measured standard times to get a baseline, and found where the reporting effort was going. If I had started by building the app, I would have digitised the waste along with the rest.
The platform
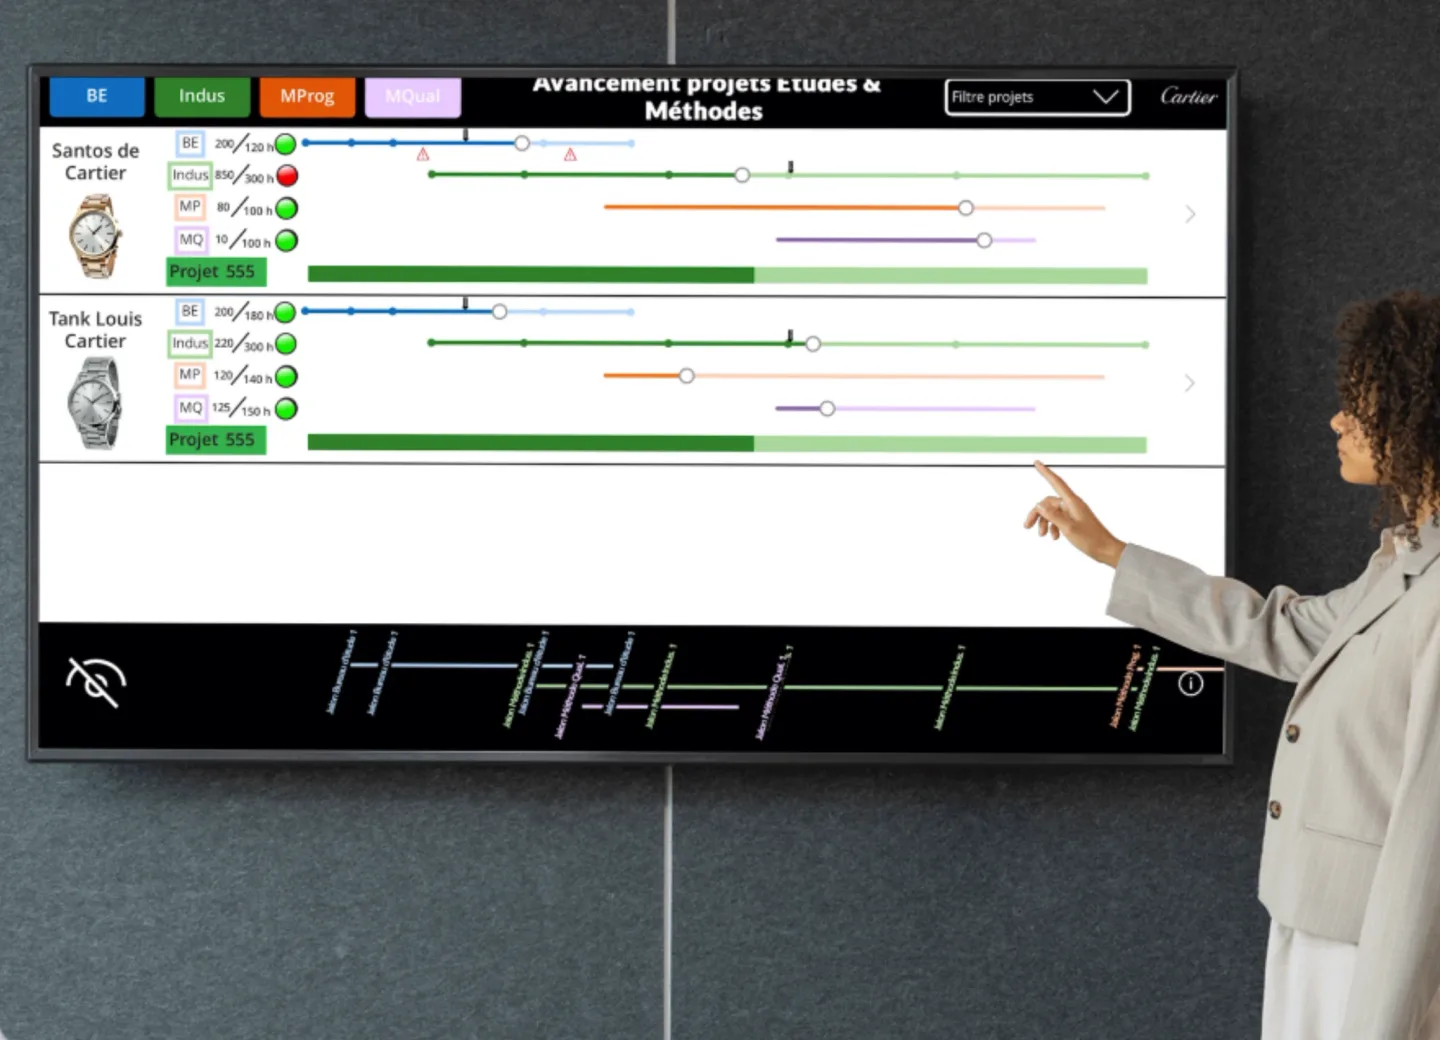
The result is a Power Apps application on live enterprise data. Power Automate runs the flows, Power Query prepares the data and Power BI does the analysis. Every department's projects, hours and status sit on one board in the same format, and the bottlenecks are visible.
The stack it runs on
Getting it used
An internal tool is only useful if people open it. I ran workshops, presentations and hands-on training with people at every level, from those who fill in the board to those who read it. 50+ users were trained, and reporting time went down 30%.
Where the 30% came from

What it taught me
Adoption has to be planned like the rest of the project. And because I measured the baseline before building, the 30% is a number I can prove and not one I estimated afterwards.